Source: 2020 Medicare Trustees Report, Supplementary Medical Insurance Cost‑Sharing and Premium Amount, 1967–2029.
Note: Not adjusted for inflation.
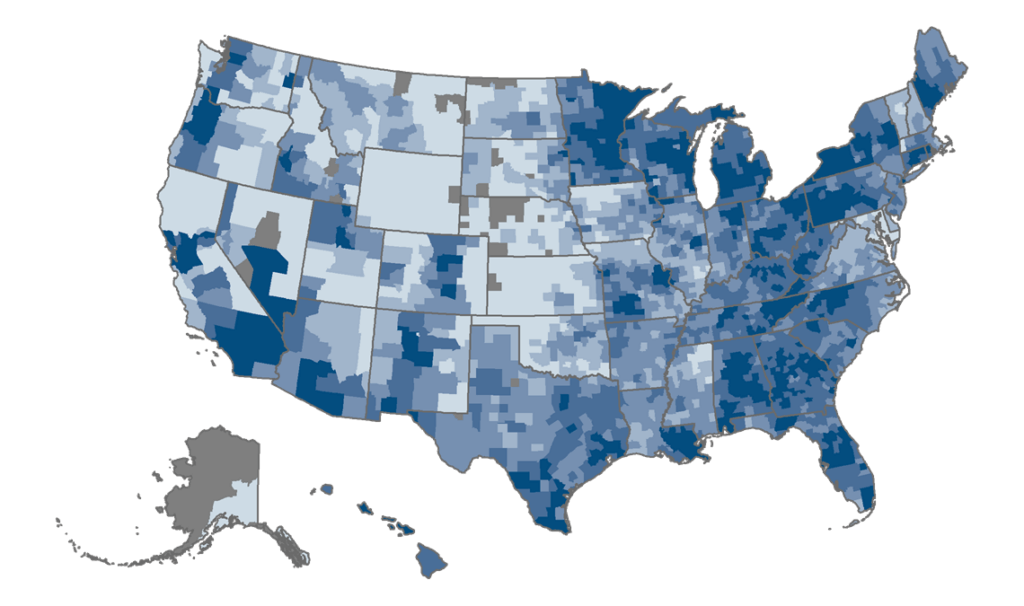
Source: CMS MA State/County Penetration File, 2020.
Note: Enrollment estimates do not include records denoted as pending state or county designation.
Percentage enrolled in Medicare Advantage nationally: 35.3
National Medicare Advantage enrollment: 24.7 million
| 2010 | 2011 | 2012 | 2013 | 2014 | 2015 | 2016 | 2017 | 2018 | 2019 | 2020 | |
|---|---|---|---|---|---|---|---|---|---|---|---|
| HMO | 7.3 | 7.8 | 8.5 | 9.4 | 10.1 | 11.1 | 11.8 | 12.4 | 13.1 | 14.0 | 15.2 |
| PPO | 1.3 | 2.2 | 2.8 | 3.2 | 3.7 | 4.1 | 4.2 | 5.0 | 5.7 | 6.9 | 8.0 |
| Private Fee-for-Service | 1.7 | 0.6 | 0.5 | 0.4 | 0.3 | 0.3 | 0.2 | 0.2 | 0.2 | 0.1 | 0.1 |
| Regional PPO | 0.8 | 1.1 | 0.9 | 1.1 | 1.2 | 1.2 | 1.3 | 1.4 | 1.3 | 1.3 | 1.2 |
| Total | 11.0 | 11.7 | 12.8 | 14.1 | 15.4 | 16.7 | 17.5 | 18.9 | 20.3 | 22.3 | 24.4 |
Source: CMS Monthly Contract and Summary Enrollment Reports, March 2009–2020.
Note: Enrollment estimates do not include records denoted as pending state or county designation; totals include beneficiaries enrolled in employer/union-only group plans. Total does not include all Medicare Advantage plan types; actual enrollment is higher than shown in this table.
Source: CMS Medicare Advantage State/County Penetration File, March 2020.
Note: Enrollment estimates do not include records denoted as pending state or county designation. Data include counts for local Coordinated Care Plans (CCP); Regional CCP; Medical Savings Accounts (MSA); Private Fee-for-Service (PFFS); Demonstrations; National PACE; 1976 Cost; HCPP–1933 Cost; Employer Direct PFFS.
Source: CMS MA State/County Penetration File, 2020.
Note: Enrollment estimates do not include records denoted as pending state or county designation.
Percentage enrolled in Medicare Advantage nationally: 35.3
National Medicare Advantage enrollment: 24.7 million
| 2010 | 2011 | 2012 | 2013 | 2014 | 2015 | 2016 | 2017 | 2018 | 2019 | 2020 | |
|---|---|---|---|---|---|---|---|---|---|---|---|
| HMO | 7.3 | 7.8 | 8.5 | 9.4 | 10.1 | 11.1 | 11.8 | 12.4 | 13.1 | 14.0 | 15.2 |
| PPO | 1.3 | 2.2 | 2.8 | 3.2 | 3.7 | 4.1 | 4.2 | 5.0 | 5.7 | 6.9 | 8.0 |
| Private Fee-for-Service | 1.7 | 0.6 | 0.5 | 0.4 | 0.3 | 0.3 | 0.2 | 0.2 | 0.2 | 0.1 | 0.1 |
| Regional PPO | 0.8 | 1.1 | 0.9 | 1.1 | 1.2 | 1.2 | 1.3 | 1.4 | 1.3 | 1.3 | 1.2 |
| Total | 11.0 | 11.7 | 12.8 | 14.1 | 15.4 | 16.7 | 17.5 | 18.9 | 20.3 | 22.3 | 24.4 |
Source: CMS Monthly Contract and Summary Enrollment Reports, March 2009–2020.
Note: Enrollment estimates do not include records denoted as pending state or county designation; totals include beneficiaries enrolled in employer/union-only group plans. Total does not include all Medicare Advantage plan types; actual enrollment is higher than shown in this table.
Source: CMS Plan and Premium Information for Medicare Plans Offering Part D Coverage, 2010–2020.
Notes: Data represent average plan premiums weighted by plan enrollment and are not adjusted by inflation. Data do not include Special Needs Plans, employer-sponsored plans, Part B–only plans, or plans not offering a Part D drug benefit. The Part C premium covers Medicare medical and hospital care; the Part D premium is a total (basic and supplemental) premium.
Source: CMS Plan and Premium Information for Medicare Plans Offering Part D Coverage, 2021.
Notes: PACE, Part B–only plans, employer-sponsored plans, and plans under sanction are excluded. Special Needs Plans are excluded from the “All Medicare Advantage Plans” average.
Source: CMS Medicare Advantage Landscape File, 2021.
Notes: PACE, Special Needs Plans, Part B–only plans, employer-sponsored plans, and plans under sanction are excluded.
Source: CMS Plan Benefit Package, 2021 (Updated as of October 1, 2020).
Source: CMS Plan Benefit Package, 2021 (Updated as of October 1, 2020).
Source: CMS MA Landscape Source Files, 2010–2021.
Note: Data represent the average number of plans operating in counties across the U.S. and Puerto Rico, weighted by the number of Medicare beneficiaries in each year. (Data for 2021 are weighted by September 2020 beneficiaries.) PACE, Special Needs Plans, Part B–only plans, employer-sponsored plans, plans under sanction, and records denoted as pending state or county designation are excluded.
Sources: CMS MA Landscape Source File, 2010–2021.
Notes: Data for the following organization types are included: local Coordinated Care Plans (CCP); Regional CCP; Medical Savings Accounts (MSA); Private Fee-for-Service (PFFS); Demonstrations; National PACE; 1976 Cost; HCPP – 1933 Cost; Employer Direct PFFS.
Source: CMS SNP Landscape Source File, 2010–2021.
Note: Employer-sponsored plans, demonstrations, and plans under sanction are excluded from SNP counts.
Source: CMS SNP Comprehensive Report, 2020 (March version).
Note: Dual eligibles describes individuals who receive both Medicare and Medicaid benefits. Medicare acts as the primary payer for most services, while Medicaid may help pay for premiums, cost-sharing, and benefits not covered by Medicare. Beneficiaries must be dually eligible for Medicare and Medicaid to enroll in a dual SNP (D-SNP).
Source: CMS State/County Penetration, and SNP Landscape Source File, 2010–2021.
Note: Estimates do not include records denoted as pending state or county designation.
Source: CMS SNP Landscape Source File, 2021.
Note: Employer-sponsored plans, demonstrations, and plans under sanction are excluded from SNP counts.
Source: CMS SNP Landscape Source Files, 2021.
Notes: Employer-sponsored plans and plans under sanction are excluded.
Source: CMS PDP State/County Penetration File, March 2020.
Note: Enrollment estimates do not include records denoted as pending state or county designation. This file contains data for the following organization types (where there are active contracts): PDP; employer/union-only direct-contract PDP.
National % enrolled in PDP Plan: 37%
National PDP enrollment: Approx. 25.2 million
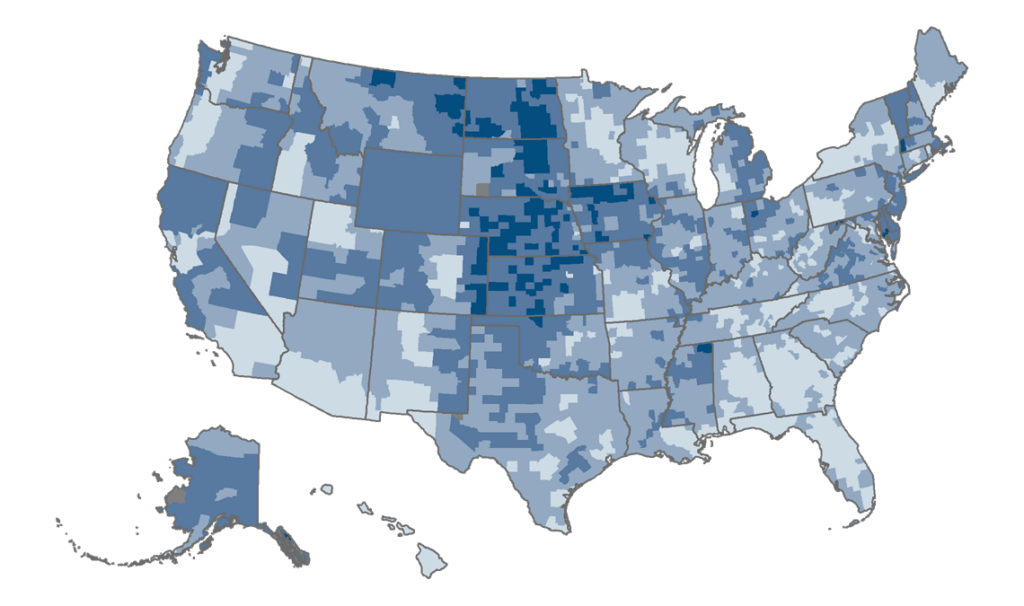
Source: CMS PDP State/County Penetration File, March 2020.
Note: Enrollment estimates do not include records denoted as pending state or county designation.
Source: CMS State/County Penetration, and PDP Landscape Source Files, 2010–2021.
Note: Data represent the average number of plans operating in counties across the U.S., weighted by the number of Medicare beneficiaries in each year. (Data for 2021 are weighted by September 2020 beneficiaries.) Employer-sponsored plans and plans under sanction are excluded. Estimates do not include records denoted as pending state or county designation.
Source: CMS Plan and Premium Information for Plans Offering Part D Coverage, 2021.
Notes: Amounts represent total Part D premiums, which are the sum of the Basic and Supplemental Premiums. Total premium may be lower than the sum of the basic and supplemental premiums because of negative basic or supplemental premiums. MA-PD average excludes employer-sponsored plans, Part B–only plans, demonstration, cost plans, and plans not offering Part D benefits.
Source: CMS Plan and Premium Information for Plans Offering Part D Coverage, 2011–2020.
Notes: Data represent average plan premiums weighted by plan enrollment and are not adjusted for inflation. Amounts represent total Part D premiums, which are the sum of the basic and supplemental premiums. Total premium may be lower than the sum of the basic and supplemental premiums because of negative basic or supplemental premiums. Employer-sponsored plans and plans under sanction are excluded.
MA-PD = Medicare Advantage prescription drug plan; PDP = Stand-alone prescription drug plan.
Source: CMS Low Income Subsidy Enrollment by Plan, 2010-2020.
Note: Enrollment estimates do not include plan records suppressed because of a value of 10 or less. Only includes Medicare Advantage plans with Part D coverage.
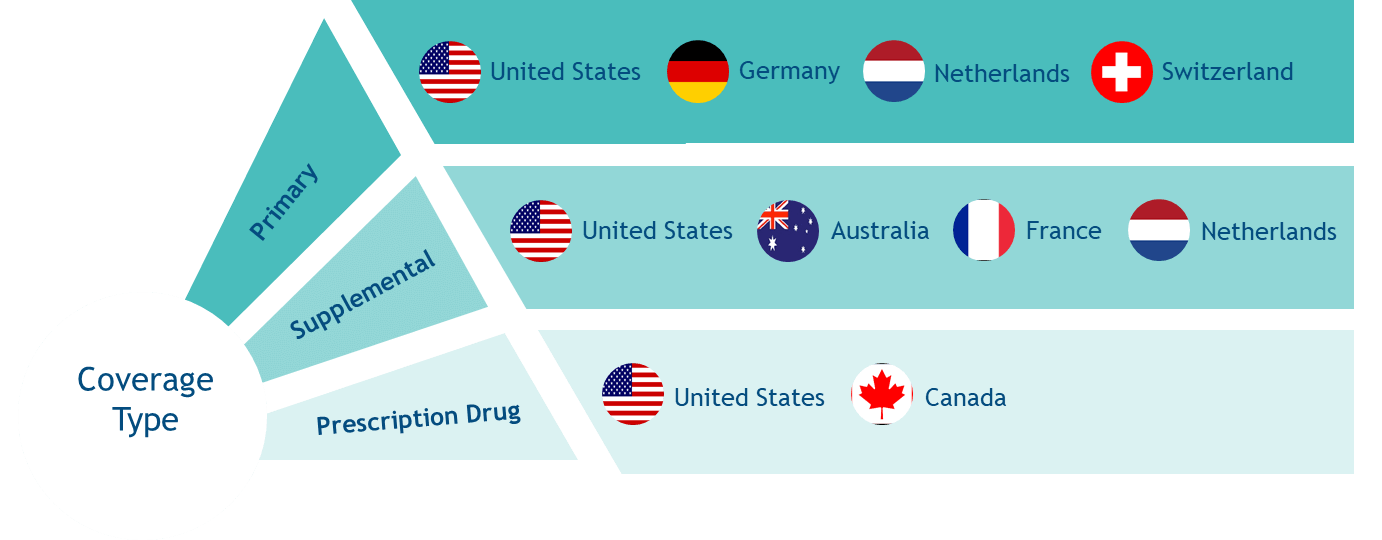
Private health insurance plans serve diverse roles in nations’ health care systems. In Germany, Netherlands, and Switzerland, private plans are the primary source of insurance and cover essential health benefits. In Australia, Netherlands, and France, people can purchase private plans that provide coverage supplemental to the primary insurance source for such things as adult dental or vision care, physical therapy, private hospital rooms, or greater choice of private providers. In Canada, people can purchase private plans that provide only outpatient prescription drug coverage.
In the United States, private health insurance plans play a pivotal role. Private plans provide primary coverage through Medicare Advantage plans, the Affordable Care Act (ACA) marketplaces, employer-sponsored plans, and some Medicaid managed care organizations. Examples of supplemental or wrap-around coverage provided by private plans include Medigap (for Medicare beneficiaries), critical illness insurance, and indemnity insurance plans. Medicare Part D stand-alone prescription drug plans (PDPs) are an example of private plans that offer only prescription drug coverage.
For more information, see https://www.commonwealthfund.org/international-health-policy-center/system-profiles.
Source: The Commonwealth Fund/London School of Economics 2020 International Profiles of Health Care Systems, June 2020.

Connect with us to explore how our trusted solutions can help you reach your goals. Fill out the form below, and a member of our team will follow up with personalized details for your organization.